Performance analysis
Introduction
preCICE uses an internal profiling framework to measure code sections inside and between API calls of the library. Existing external frameworks cannot cope with the complexity of the multi-executable setup of preCICE. To understand the performance of a coupled run, it is necessary to look at the interplay of all coupled participants.
These named code sections are called events and each event generates records during runtime.
Each rank of each participant gathers local records and writes them to a file.
To store these files, preCICE creates a directory called precice-profiling in the current working directory of each participant.
All these files of all participants then need to be post-processed and merged to a single profiling file.
You can then use various tools to analyze, visualize, and export the profiling data for use in other tools.
Tools
The tools for processing profiling data can be found in two main locations:
- Up to version 3.2, the preCICE library installation provides a
precice-profilingscript. For full functionality, some additional dependencies must be installed separately. This script has been deprecated after version 3.2, reduced to merge support and will be removed in version 4.0. - The PyPi package
precice-cliprovides the profiling tools via theprofilinggroup. It has the advantage of installing all necessary dependencies along it.
Install the tools using pipx:
$ pipx install precice-cli
creating virtual environment...
installing precice-cli...
done! ✨ 🌟 ✨
  installed package precice-cli 0.2.0, installed using Python 3.13.3
  These apps are now globally available
    - precice-cli
The find the profiling tools in the precice-cli profiling section.
The most important tools include:
mergemerges rank files after a simulation to a single profiling file for further processing.traceconverts the profiling data into the trace events format for visualization.exportconverts the profiling data into a CSV file to interface with other programs.analyzeto analyze the profiling information of a single solver
precice-profiling PyPi package.
Each command is available as a separate executable starting with precice-profiling-.
For example the standalone version of precice-cli profiling merge is precice-profiling-merge.
Fundamental Events
Some events are useful for everyone, while others are only useful for developers. To keep this feature as useful as possible, we pre-selected a set of events that we deem fundamental. These include the main preCICE API functions and the time spent between these calls inside the solvers. Fundamental events should give you an insight in the overhead of preCICE as well as load imbalance between ranks etc.
Fundamental events are:
_GLOBALDeprecated: Time from profiling framework initialization (EventRegistry::initialize) to finalization (EventRegistry::finalize), spanning the full participant lifetime.construction: Time in participant construction, including setup checks,configure, profiling backend startup, MPI setup, and optional intra-participant communication initialization.configure: Time spent parsing and applying the preCICE XML configuration.com.initializeMPI: Time spent initializing or detecting MPI and validating communicator consistency.com.initializeIntraCom: Time spent establishing intra-participant communication independent of backend.solver.initialize: Solver-side time between participant construction and callinginitialize(). This typically includes mesh setup, initial data, and solver preparation.initialize: Total time inside preCICEinitialize(), including inter-participant communication setup, initial mapping/data handling, coupling-scheme initialization, and initial exports.reinitialize: Time spent in participant reinitialization, includes large parts ofinitialize.initalizeCouplingScheme: Time spent initializing coupling scheme and acceleration.m2n.requestPrimaryRankConnection.<participant>andm2n.acceptPrimaryRankConnection.<participant>: Time spent establishing primary-rank inter-communication, including handshake and compatibility checks.mapping: Time spent mapping samples in configured read and write mappings.solver.advance: Solver-side time for computing each time-step. It contains the time betweeninitialize(), the firstadvance()and followingadvance()calls.advance: Total time inside preCICEadvance(), including timestep handling, mapping/data actions, and coupling advancement.advanceCoupling: Time spent inside coupling-scheme advancement and synchronization/exchange steps. Note that for serial coupling-schemes, this includes the timestep of the other participant.syncTimestep: Time spent synchronizing and validating timestep sizes across all ranks of a single participant.waitAndSendDataandwaitAndReceiveData: Time spent exchanging coupling data.accelerate: Time spent in implicit-coupling acceleration routines.sendConvergenceandreceiveConvergence: Time spent exchanging the evaluated convergence criteria in implicit coupling.finalize: Time inside preCICEfinalize(), including coupling finalization, communication shutdown, profiling finalization, and MPI finalization if applicable.
Full API-profiling
To profile the full API including mesh definition and data access functions, you can use the api mode.
This can be especially useful to understand the cost of just-in-time mappings or when dealing with large meshes in general. Be aware that this may lead to large profiling files especially when using the API in an inner loop.
User-defined events
You can measure your own code sections in your adapter code, which are then directly integrated into the profiling output of preCICE. These events are always considered to be fundamental and are thus recorded by default.
As an example, let’s take the code from our couple your code guide. Here we want to profile the time taken to solve the timestep in the coupling loop.
 precice.readData("FluidMesh", "Displacements", vertexIDs, dt, displacements);
 setDisplacements(displacements);
+precice.startProfilingSection("solveTimeStep");
 solveTimeStep(dt);
+precice.stopLastProfingSection();
 computeForces(forces);
 precice.writeData("FluidMesh", "Forces", vertexIDs, forces);
The profiling output now contains the event solveTimeStep which is nested under solver.advance.
Measuring Blocking Operations
Some parts of preCICE involve communication, which cannot be interleaved efficiently with other computations. Measuring the runtime of such operations can be tricky, as the time spent waiting should not be misinterpreted. Synchronizing all ranks using a barrier solves the issue, but has an impact on performance.
To keep this waiting component of the overall measurement to a minimum without affecting performance, we added a configuration option to toggle the synchronization before required events.
Use the synchronize attribute to enable such synchronization if you need it.
<precice-configuration>
    <profiling synchronize="true" />
</precice-configuration>
Configuration
You can configure the profiling with the <profiling/> tag located inside <precice-configuration>.
The default settings enable profiling of fundamental events and write the event files the working directory of each solver.
The full configuration consists of:
modeeitheroff,fundamental(default),api(since version 3.3), oralldirectorylocation to create theprecice-profilingfolder in and write the profiling files to- the flush frequency
flush-every:0means only at the end of the simulation,n>0means to flush every n records
Examples
To turn the profiling off:
<precice-configuration>
  <profiling mode="off" />
</precice-configuration>
To write the files of all participants into a common directory (often .. works too):
<precice-configuration>
  <profiling directory="/path/to/dir" />
</precice-configuration>
To prevent any write operations of the filesystem until the end of the simulation:
<precice-configuration>
  <profiling flush-every="0" />
</precice-configuration>
To profile blocking operations:
<precice-configuration>
  <profiling mode="all" synchronize="true" />
</precice-configuration>
To profile all preCICE operations in a scaling test only writing to the filesystem at the end:
<precice-configuration>
  <profiling mode="all" flush-every="0" />
</precice-configuration>
Post-processing workflow
The general workflow looks as follows:
- Run the simulation
- Merge the event files
- Analyze each participant executing a mapping or computing acceleration
- Analyze each participant to check for load-imbalance between ranks
- Visualize the simulation to check for load-imbalance between participants
The rest of the section will go through the process of analyzing participants step by step.
Merging Event Files
.txt for rank files and a sqlite3 database profiling.db for profiling data.
The merge tool supports both formats.
After the simulation completes, you can find precice-profiling folders in the configured location, defaulting to the working directory of each participant.
An example could look like this:
.
├── A
│   └── precice-profiling
│       └── A-0-1.txt
├── B
│   └── precice-profiling
│       └── B-0-1.txt
└── precice-config.xml
where the naming pattern is participant-rank-file_number. To find and merge these files run:
$ ls
A
B
$ precice-cli profiling merge
Found 2 files in .
Found a single run for participant B
Found a single run for participant A
Loading 2 event files
Loading precice-profiling/B-0-1.txt
Processing precice-profiling/B-0-1.txt
Loading precice-profiling/A-0-1.txt
Processing precice-profiling/A-0-1.txt
Align participant ranks
Align participants
Aligning B with A shift latter by 5
$ ls
A
B
profiling.db
The merge command searches the current directory recursively for event files. You can also pass individual directories to be searched, or individual event files to use. You can also pass individual files if you are not interested in all ranks. To tell the merge to search only folders A and B run:
precice-cli profiling merge A B
Found 1 files in A
Found 1 files in B
Found 2 profiling files in total
Found a single run for participant A
Found a single run for participant B
Loading 2 event files
Loading A/precice-profiling/A-0-1.txt
Processing A/precice-profiling/A-0-1.txt
Loading B/precice-profiling/B-0-1.txt
Processing B/precice-profiling/B-0-1.txt
Align participant ranks
Align participants
Aligning B with A shift latter by 5
The merge command is written in pure Python, without external dependencies, to make it easy to use on clusters.
After you run precice-cli profiling merge, you end up with a single file, which can be additionally compressed and transferred to another machine.
This is especially handy for very large and/or long simulations on clusters or supercomputers.
The result of this step is a single profiling.db file.
Visualizing the simulation
You can run precice-cli profiling trace to export the profiling.db file as trace.json in the trace events format.
$ precice-cli profiling trace
Reading profiling file profiling.db
Writing to trace.json
This trace format can then be visualized using the following tools:
- ui.perfetto.dev, which can handle larger traces
- profiler.firefox.com
- speedscope.app
chrome://tracing/in Chromium browsers (see full list)
Use precice-cli profiling trace --web to directly open the exported trace in the browser.
These visualization tools cannot handle large runs though.
There are two options to reduce the trace size:
You can select the first N ranks using -l N and you can pick specific ranks using -r RANK ...
These two selectors are combined.
As an example, to select the first 3 ranks and in addition ranks 10 and 200:
$ precice-cli profiling trace -l 3 -r 10 200
Reading profiling file profiling.db
Selected ranks: 0,1,2,10,200
Writing to trace.json
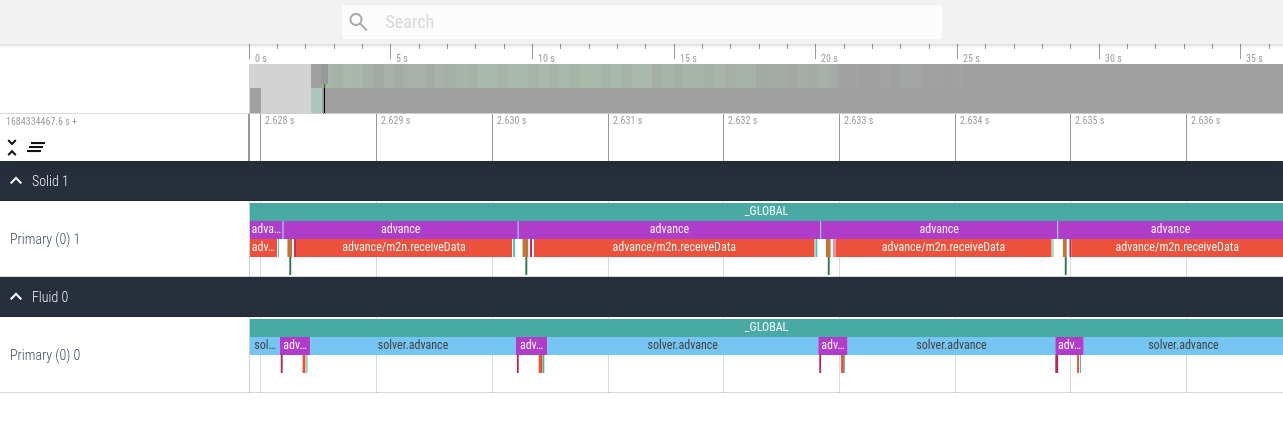
An example trace visualization using ui.perfetto.dev of the elastic tube 1d tutorial looks as follows.
Note the alternating executions of the solver due to the serial coupling scheme.
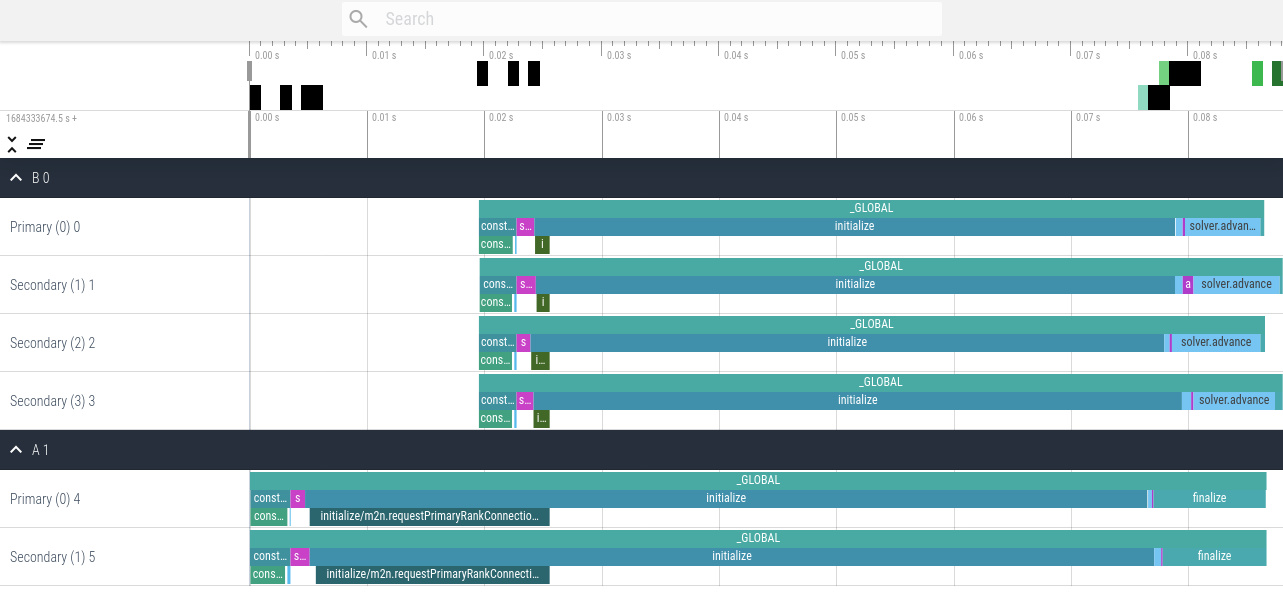
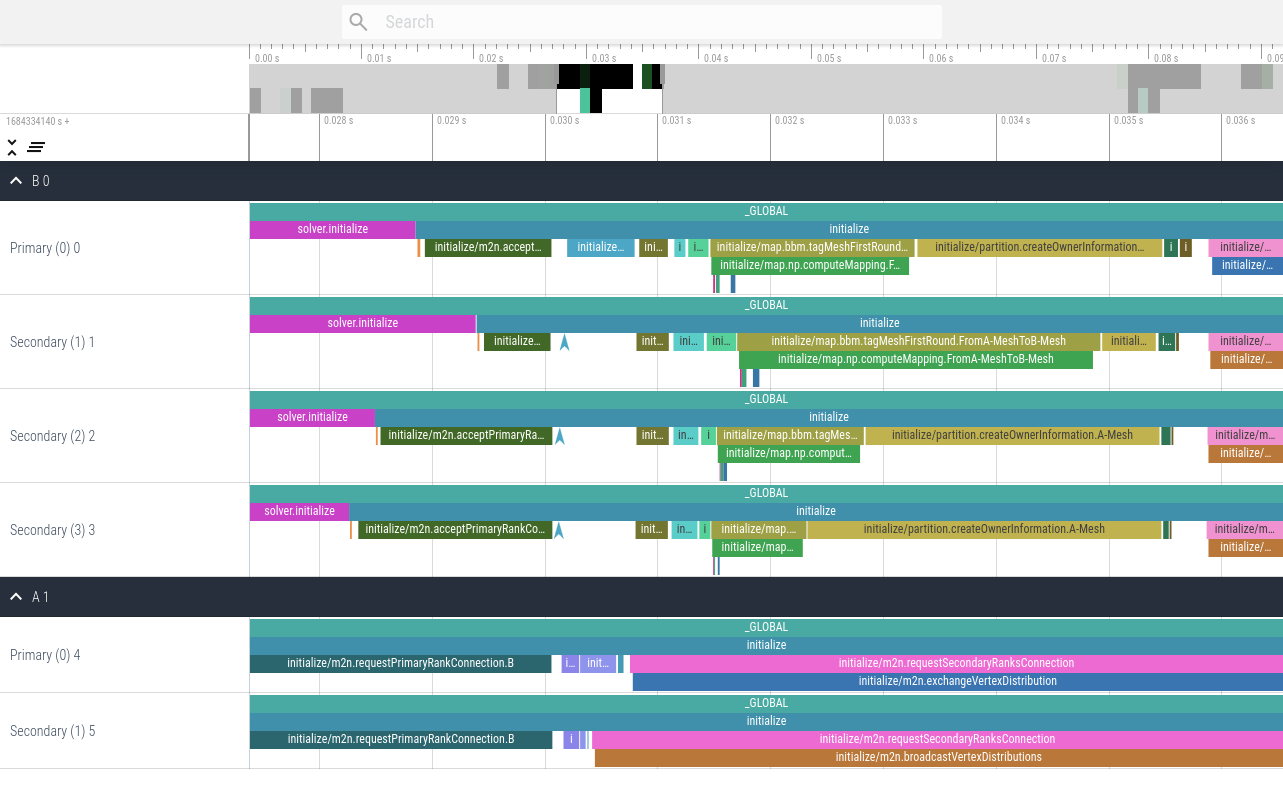
An example trace visualization using ui.perfetto.dev of a parallel ASTE run on two and four ranks looks as follows.
This first version contains only fundamental events, which is the default profiling setting.
This second version contains all events using the configuration <profiling mode="all" />.
Analyzing participants
You can run precice-cli profiling analyze NAME to analyze the participant NAME and display a table of recorded events.
The output differs for serial and parallel participants.
The output for serial solvers contains a table displaying the name of the event, followed by the sum, count, mean, min, and max runtime.
$ precice-cli profiling analyze Fluid
Reading profiling file profiling.db
Output timing are in us.
                                            event |        sum    count               mean        min        max
                                          _GLOBAL | 34125973.0        1         34125973.0 34125973.0 34125973.0
                                          advance | 32893268.0      793 41479.530895334174      116.0    45942.0
                                     construction |    59470.0        1            59470.0    59470.0    59470.0
                           construction/configure |    59265.0        1            59265.0    59265.0    59265.0
                                         finalize |    42664.0        1            42664.0    42664.0    42664.0
                                       initialize |   181787.0        1           181787.0   181787.0   181787.0
initialize/m2n.requestPrimaryRankConnection.Solid |      266.0        1              266.0      266.0      266.0
                                   solver.advance |   947727.0      794  1193.610831234257      550.0    15470.0
                                solver.initialize |       29.0        1               29.0       29.0       29.0
The output for parallel solvers is slightly more complex. After the name of the event, the table contains three blocks, each containing the sum, count, mean, min, and max runtime for a specific rank.
- The first block displays the primary rank (0).
- The second block displays the secondary rank which spent the least total time in the event given via
--event EVENT. By default,--event advanceis used. - The third block displays the secondary rank which spent the most total time in the event given via
--event EVENT. By default,--event advanceis used.
$ precice-cli profiling analyze --event advance B
Reading profiling file profiling.db
Output timing are in us.
Selection contains the primary rank 0, the cheapest secondary rank 2, and the most expensive secondary rank 1.
                                       event |   R0:sum R0:count  R0:mean   R0:min   R0:max |   R2:sum R2:count  R2:mean   R2:min   R2:max |   R1:sum R1:count  R1:mean   R1:min   R1:max
                                     _GLOBAL |  66888.0        1  66888.0  66888.0  66888.0 |  66953.0        1  66953.0  66953.0  66953.0 |  68462.0        1  68462.0  68462.0  68462.0
                                     advance |    170.0        1    170.0    170.0    170.0 |    154.0        1    154.0    154.0    154.0 |    905.0        1    905.0    905.0    905.0
                                construction |   3179.0        1   3179.0   3179.0   3179.0 |   3171.0        1   3171.0   3171.0   3171.0 |   3132.0        1   3132.0   3132.0   3132.0
         construction/com.initializeIntraCom |    130.0        1    130.0    130.0    130.0 |    157.0        1    157.0    157.0    157.0 |    153.0        1    153.0    153.0    153.0
                      construction/configure |   2863.0        1   2863.0   2863.0   2863.0 |   2828.0        1   2828.0   2828.0   2828.0 |   2786.0        1   2786.0   2786.0   2786.0
                                    finalize |    291.0        1    291.0    291.0    291.0 |    365.0        1    365.0    365.0    365.0 |    251.0        1    251.0    251.0    251.0
                                  initialize |  54588.0        1  54588.0  54588.0  54588.0 |  54008.0        1  54008.0  54008.0  54008.0 |  54450.0        1  54450.0  54450.0  54450.0
initialize/m2n.acceptPrimaryRankConnection.A |   1227.0        1   1227.0   1227.0   1227.0 |   1569.0        1   1569.0   1569.0   1569.0 |   1123.0        1   1123.0   1123.0   1123.0
                              solver.advance |   7063.0        2   3531.5    621.0   6442.0 |   8018.0        2   4009.0    454.0   7564.0 |   8016.0        2   4008.0    635.0   7381.0
                           solver.initialize |   1557.0        1   1557.0   1557.0   1557.0 |   1201.0        1   1201.0   1201.0   1201.0 |   1678.0        1   1678.0   1678.0   1678.0
Processing in other software
You can run precice-cli profiling export to export the profiling.db file as profiling.csv.
This contains CSV data including all individual events from all participants and ranks.
It also contains additional data entries attached to events.
The header of the result CSV is participant,rank,size,event,timestamp,duration,data.
$ precice-cli profiling export
Reading profiling file profiling.db
Writing to profiling.csv
Example of loading the csv into pandas and extracting rank 0 of participant A:
import pandas
df = pandas.read_csv("profiling.csv")
selection = df[ (df["participant"] == "A") & (df["rank"] == 0) ]
Advanced analysis with perfetto
So far, we used perfetto for visualizing the traces. Sometimes, these traces are either too large to inspect visually or one needs to extract more detailed data from the traces than simple event-wise duration sums.
The perfetto project additionally provides a complete ecosystem of tools for trace processing. PerfettoSQL and the trace processor allow to systematically extract data from large profiling records.
PerfettoSQL for preCICE
Important mappings between the two systems are:
- a preCICE participant corresponds to a process in perfetto
- a preCICE rank corresponds to a thread in perfetto, nested under the process of the participant
- one preCICE Event corresponds to a row in the slice table of perfetto
The most important STL component is the thread_slice in the slices.with_context module.
It adds the thread and process name to each slice, which allows filtering for participant and rank.
INCLUDE PERFETTO MODULE slices.with_context;

select *
from thread_slice
where process_name = 'B';
The rank is a string the format Rank {rank}.
The following extracts all slices of the primary rank 0.
select *
from thread_slice
where process_name = 'B' and thread_name = "Rank 0"
Prototyping queries in the UI
After importing a trace into perfetto UI, clicking the SQL tab on the left opens a text input. Here, you can run SQL queries, see and download the results. This is great for prototyping queries quickly directly in the browser.
If the output of the query is something that resembles a slice, then you can load it directly into the timeline view.
Recently executed query results can be seen in the bottom of the timeline.
Here you can also click “Show debug track” which will load all slices into a single track.
To group into multiple tracks based on a column such as thread_name, select it as pivot.
Then click “add track” to show the result of the query.
If you don’t need to see the other tracks, it may be a good idea to change to a new blank workspace first.
Scripting the processing
For the scripting, we recommend using the trace processor included in the python package perfetto.
pip install perfetto
In your script:
from perfetto.trace_processor import TraceProcessor

tp = TraceProcessor("profiling.pftrace") # or "trace.json"
After that, you can run queries using tp.query():
tp.query("SELECT count(*) from slice")
The result of a query can be:
- accessed as a
numpy.ndarrayusingtq.query(...).cells - iterated over using
for row in tq.query(...): - or exported to a
pandas.Dataframeusingtq.query(...).as_pandas_dataframe()
You can also use queries to create views or tables to make the processing a bit more convenient.
If you create tables make sure to use CREATE PERFETTO TABLE to get a table tuned for analytics queries.
Helper
The following table gives for every slice, the total time spent in .sync events in case synchronization is enabled in the configuration.
CREATE PERFETTO TABLE synctime AS
SELECT a.id AS sid, sum(s.dur) AS synctime
FROM slice AS s
JOIN ancestor_slice(s.id) a
WHERE s.name GLOB '*.sync'
GROUP BY a.id;
The following is a view that uses preCICE terminology and allows to work with participant and numeric ranks:
CREATE VIEW precice AS
SELECT process_name as participant, cast_int!(SUBSTR(thread_name, 6)) AS rank, *
FROM thread_slice;