Perpendicular flap with stresses
Setup
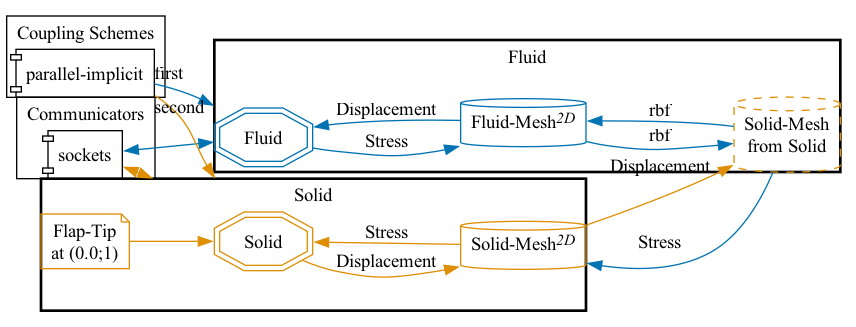
The scenario is exactly the same as the one described in the perpendicular flap tutorial. The only difference is that we use stresses instead of forces as data sent from the fluid to the solid participant. This requires changing the mapping constraint from conservative (forces) to consistent (stresses). To avoid a “write-consistent” combination, which cannot be used in parallel, we exchange both meshes.
Configuration
preCICE configuration (image generated using the precice-config-visualizer):
Available solvers
Fluid participant:
- OpenFOAM (pimpleFoam). For more information, have a look at the OpenFOAM adapter documentation.
Solid participant:
- G+Smo (perpendicular-flap-vertex-gismo). This solver includes both linear and nonlinear versions of the Newmark time integrator for time-dependent structural problems. The linear version iterates using a constant stiffness matrix. The nonlinear version iterates using an updated Jacobian matrix to account for material or geometric nonlinearity. By default, the solver runs in linear mode. To switch to nonlinear mode, add
--nonlinearas option inrun.sh. For more information, have a look at the G+Smo adapter documentation.
Running the simulation
Open two separate terminals and start the desired fluid and solid participants by calling the respective run scripts run.sh located in the participants’ directories. For example:
cd fluid-openfoam
./run.sh
and
cd solid-gismo
./run.sh
Post-processing
On the OpenFOAM side, you can open the .foam file with ParaView, or create VTK files with foamToVTK.
On the G+Smo side, you can open the .pvd file located in the solid-gismo/output folder using ParaView. If you prefer not to plot the simulation, simply edit the run.sh script and remove the --plot option.
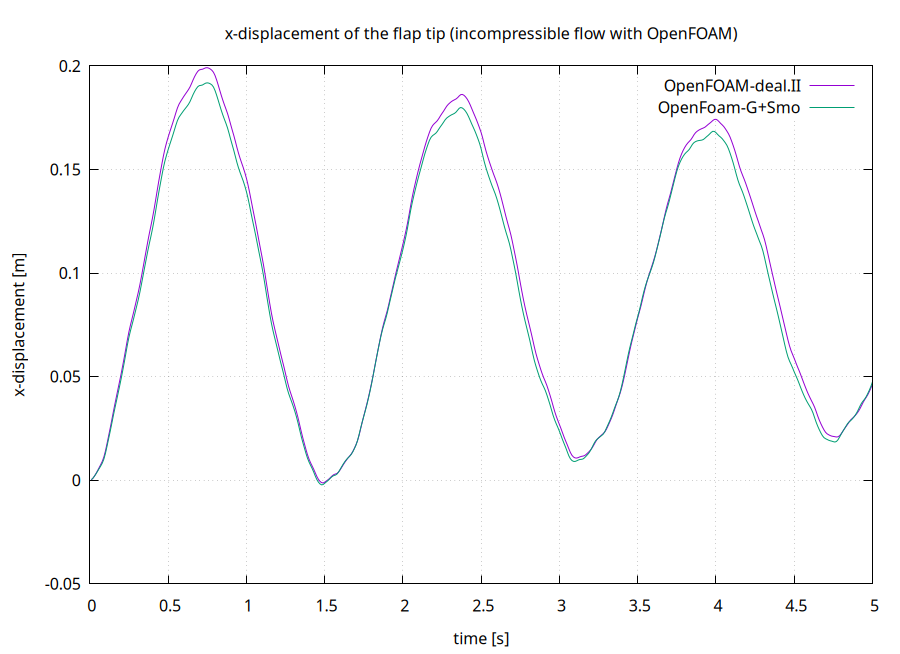
As we defined a watchpoint on the ‘Solid’ participant at the flap tip (see precice-config.xml), we can plot it with gnuplot using the script plot-displacement.sh. You need to specify the directory of the selected solid participant as a command line argument, so that the script can pick-up the desired watchpoint file, e.g. plot-displacement.sh solid-gismo. The resulting graph shows the x displacement of the flap tip. You can modify the script to plot the force instead.